Analytics Guide
Understand your B2B ordering data with built-in analytics.
Overview
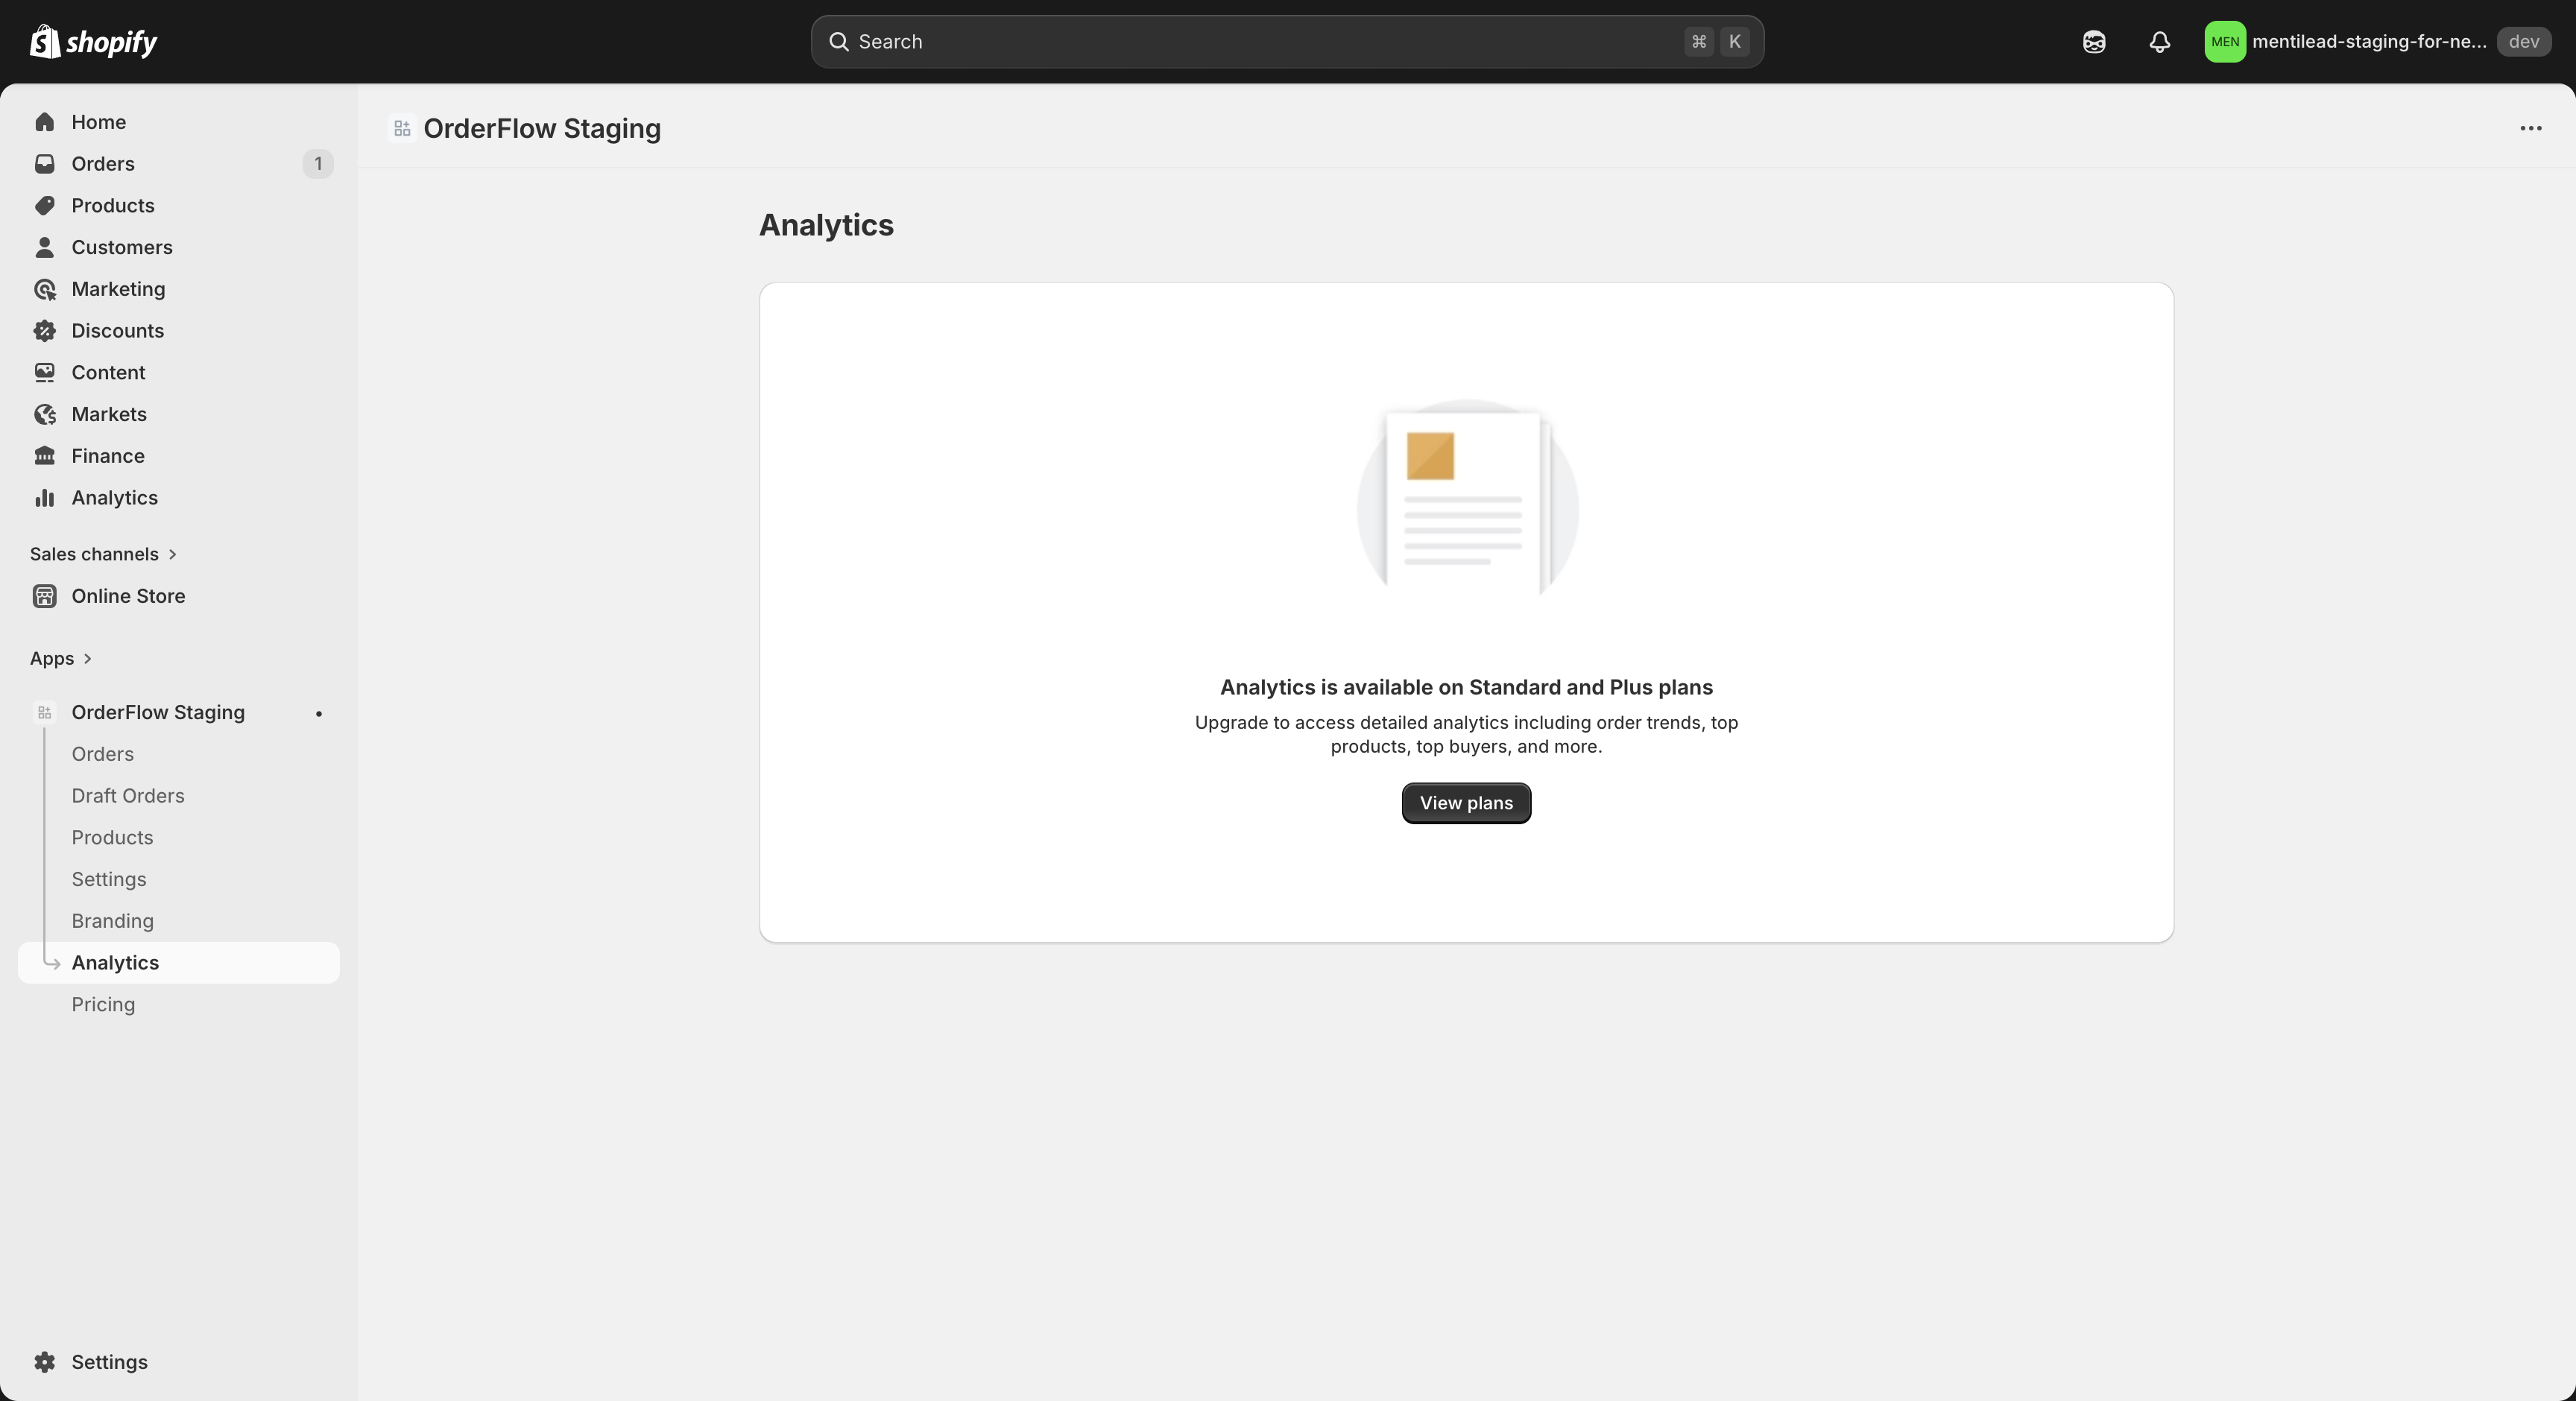
The Analytics page gives you a dashboard view of your OrderFlow ordering data, available on the Standard and Plus plans. It shows high-level metrics at a glance, identifies your top-performing products and most active buyers, and breaks down how orders arrive — whether through product search, CSV upload, or the reorder feature.
All data is computed on-the-fly from your order history stored in DynamoDB. There is no separate analytics database, no delayed syncs, and no third-party tracking scripts. When you open the Analytics page, you see current data based on your actual orders. This keeps the system simple, fast, and privacy-friendly.
Free plan merchants see a plan-gated message on the Analytics page with an upgrade prompt explaining what's available on Standard and Plus. This is intentional — analytics becomes valuable once you have meaningful order volume, which typically aligns with when the paid plans make sense for your business.
The dashboard is designed for quick scanning. The four summary cards give you the big picture in seconds. The tables below let you drill into product and customer specifics. Together, they answer the questions B2B merchants ask most often: How much are we selling? What's selling best? Who's buying the most? And how are they ordering?
Summary Cards
At the top of the Analytics page, four metric cards provide a high-level snapshot of your ordering activity for the current period. Each card displays a single number with a label, making it easy to assess business health in seconds.
The four cards are:
- Orders — The total number of orders placed through OrderFlow this period. This counts all completed checkouts regardless of source (search, CSV, or reorder).
- Revenue — The total monetary value of all orders this period, displayed in your store's currency. This is the sum of all order totals before taxes and shipping.
- Customers — The number of unique customers who placed at least one order this period. A customer who orders five times counts as one unique customer.
- Average Order Value (AOV) — Revenue divided by the number of orders. This metric helps you understand the typical order size and track whether your B2B buyers are ordering more or less over time.
Each card includes a comparison indicator showing how the current value relates to the previous period. The time period defaults to the current calendar month. These summary cards are your first stop for understanding whether order volume and revenue are trending in the right direction.
If you notice a sudden change in any metric — a spike in orders, a drop in AOV, or a surge in unique customers — the tables below help you investigate by showing which products and buyers are driving the change.
Top Products
The Top Products table ranks your most-ordered products by quantity for the current period. Each row shows the product name, SKU, total quantity ordered, and the revenue generated by that product. This table answers a simple but important question: what are your buyers actually ordering?
For B2B merchants, this data is immediately actionable. If a product is consistently at the top of the list, you know to keep it well-stocked and prominently placed. If a product you expected to sell well is missing from the top ranks, it might need better visibility — consider adjusting its position in your product catalog or highlighting it in your quick order page layout.
The SKU column makes it easy to cross-reference with your inventory system, warehouse management software, or ERP. If your operations team needs a weekly report of top-moving SKUs, this table gives you the data at a glance without running custom queries or exporting spreadsheets.
Beyond inventory planning, the Top Products table helps identify cross-sell and upsell opportunities. If customers frequently order Product A, and Product B is a natural complement, you can use that insight to adjust your catalog order, create bundles, or inform your sales team's outreach strategy. The data is there — how you use it depends on your business goals.
Top Buyers
The Top Buyers table ranks your most active customers by total order value (gross merchandise value). Each row displays the customer name, the number of orders they placed, and their total revenue contribution for the current period. This is your at-a-glance view of who your most valuable B2B accounts are.
Knowing your top buyers by revenue helps you prioritize customer relationships. In B2B, a small number of accounts often generate a disproportionate share of revenue — the classic 80/20 pattern. Identifying these accounts lets you invest in the relationships that matter most: dedicated support, personalized pricing, early access to new products, or simple gestures like a check-in call.
The orders count column adds useful context. A customer with high revenue and many orders is a consistently active buyer. A customer with high revenue from just one or two orders might be placing large but infrequent bulk purchases. These two patterns call for different engagement strategies — the frequent buyer benefits from saved lists and reorder features, while the infrequent bulk buyer might appreciate CSV upload improvements or scheduled ordering.
If you're on the Plus plan, the Top Buyers data pairs well with Shopify Flow automations. You can set up workflows that automatically tag top buyers, notify your sales team when a high-value customer places an order, or trigger loyalty incentives when a customer crosses a spending threshold. The analytics page identifies the patterns; Flow lets you act on them automatically.
Source Breakdown
The Source Breakdown section shows how your orders originate, splitting them into three categories: Search (customers who searched for products and added them to the cart), CSV Import (customers who uploaded a CSV or Excel file), and Reorder (customers who used the "Buy again" button from their order history).
This distribution tells you how your buyers prefer to order. If the majority of orders come through search, your product catalog and search experience are the most critical parts of the order page. If CSV imports dominate, your buyers are likely purchasing managers with existing spreadsheets or ERP exports — they value the ability to paste or upload rather than browse. If reorders are a significant share, your customers have established purchasing patterns and the convenience of one-click repeat ordering is driving retention.
Understanding the source mix helps you make informed decisions about where to invest. A store where 70% of orders come via CSV might benefit from improving the upload experience, adding column mapping flexibility, or promoting the saved lists feature as an alternative that's even faster than re-uploading the same file each time. A store with heavy reorder usage might focus on making the order history page more prominent and easier to access.
The source breakdown also serves as a health check. If you recently promoted the CSV upload feature to your buyers and the CSV share increases in the following weeks, you know the effort had an impact. If reorder usage is low despite a loyal customer base, it might mean buyers don't know the feature exists — a prompt or tooltip could change that. The data gives you feedback loops that help you optimize the ordering experience over time.
Google Analytics 4 Integration
For deeper analytics beyond OrderFlow's built-in dashboard, you can connect your Google Analytics 4 (GA4) property. Go to Settings > Integrations in your OrderFlow admin and enter your GA4 Measurement ID in the format G-XXXXXXXXXX. Once configured, OrderFlow sends events to GA4 automatically — no additional setup or code changes required.
OrderFlow sends events via Google's Measurement Protocol (server-side), which means no client-side JavaScript analytics library is loaded on the quick order page. This has two important benefits: it keeps the page fast by avoiding the weight of the gtag.js library, and it ensures events are captured reliably even if the customer's browser blocks third-party scripts or uses an ad blocker.
Four events are tracked: page_view (when the order page loads), search (when a customer searches for products, including the search term), add_to_cart (when a product is added, including product name, SKU, and price), and begin_checkout (when the customer proceeds to checkout, including the cart total). These events map to standard GA4 e-commerce event names, so they integrate naturally with GA4's built-in reports and funnels.
Privacy is handled carefully. GA4 uses a pseudonymous client ID that is not linked to the customer's Shopify ID, email address, or any other personally identifiable information. Analytics data is only sent after checking the customer's consent status via Shopify's Privacy API. If a customer has not consented to analytics tracking, no events are sent to GA4. This ensures compliance with GDPR, CCPA, and other privacy regulations without requiring any additional configuration on your part.